In brief
Crewe Central: 40.2% private rent, 38.6% flats, 16.6% electric-only heating. Crewe South: 42.4% private rent, 38.0% terraced. Crewe North: 73.7% semis, 67.4% owned. Across Cheshire East: 15.5% private rent, 36.6% detached.
Six wards at a glance
| Ward | Households | What stands out |
|---|---|---|
| Crewe Central | 3,255 | Flats and terraces, mostly rented; the most electric heating. |
| Crewe South | 5,188 | Terraces and semis; the highest share of private renting. |
| Crewe St Barnabas | 2,197 | Semis and terraces, with a large social-rented share. |
| Crewe West | 4,524 | Semis first, then terraces; mainly owner-occupied. |
| Crewe East | 6,726 | The largest ward; semis, and more detached houses than the centre. |
| Crewe North | 2,090 | Overwhelmingly semi-detached and owner-occupied. |
Who owns and who rents
| Ward | Owned | Owned outright | Private rent | Social rent |
|---|---|---|---|---|
| Crewe Central | 26.9% | 13.4% | 40.2% | 31.7% |
| Crewe South | 43.7% | 22.9% | 42.4% | 12.8% |
| Crewe St Barnabas | 42.5% | 18.2% | 25.0% | 32.0% |
| Crewe West | 60.5% | 31.0% | 21.0% | 18.1% |
| Crewe East | 64.8% | 34.5% | 18.1% | 15.7% |
| Crewe North | 67.4% | 37.9% | 17.1% | 15.4% |
| Cheshire East | 71.9% | 39.6% | 15.5% | 11.6% |
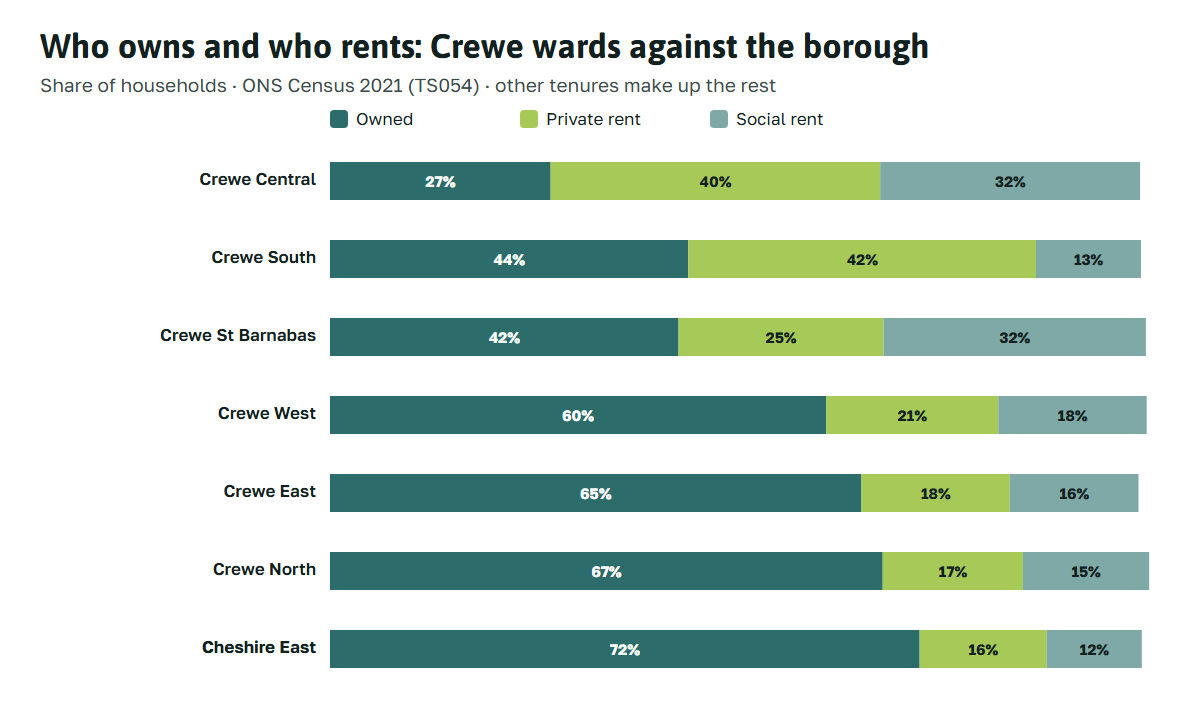
Where most homes are let, the person who decides about panels is usually not the person who lives there. In Crewe Central only 26.9% of households own their home; in Crewe St Barnabas 32.0% rent from a council or housing association, whose own programmes decide what goes on those roofs. For private lettings, see landlords and solar and renting and solar.
What kind of building
| Ward | Detached | Semi | Terraced | Flat |
|---|---|---|---|---|
| Crewe Central | 3.8% | 19.8% | 37.8% | 38.6% |
| Crewe South | 13.7% | 25.5% | 38.0% | 22.7% |
| Crewe St Barnabas | 7.3% | 50.5% | 32.7% | 9.6% |
| Crewe West | 11.0% | 50.9% | 27.8% | 10.3% |
| Crewe East | 15.9% | 53.1% | 24.8% | 6.0% |
| Crewe North | 10.6% | 73.7% | 12.4% | 3.2% |
| Cheshire East | 36.6% | 32.5% | 20.0% | 10.5% |
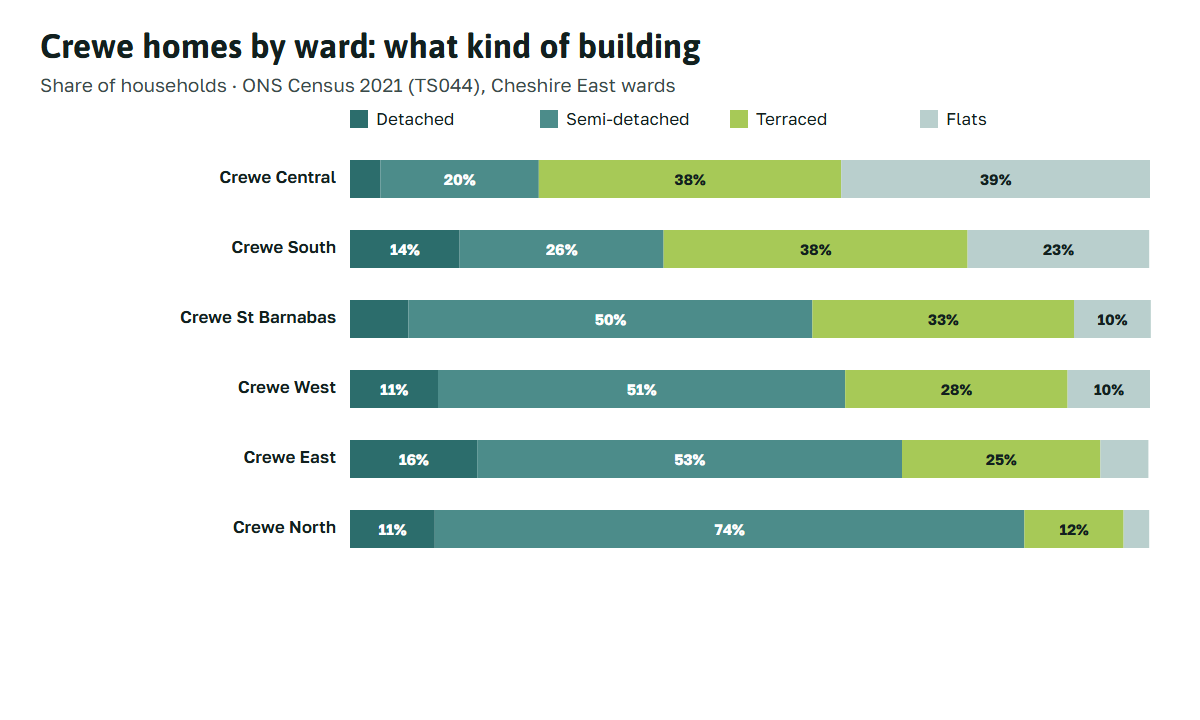
Detached houses, which usually offer the most roof to choose from, are scarce in Crewe: 3.8% in the centre and no more than 15.9% in any of the six wards, against 36.6% across the borough. The town’s solar roofs are mostly on semis and terraces. Crewe North and Crewe West are semi-detached country; the centre and south are terraces and flats. Each brings its own questions: semi-detached roofs, terraced houses and flats.
How homes are heated
| Ward | Mains gas only | Electric only | Oil only |
|---|---|---|---|
| Crewe Central | 69.6% | 16.6% | 0.2% |
| Crewe South | 75.6% | 9.8% | 0.3% |
| Crewe St Barnabas | 82.4% | 4.3% | 0.2% |
| Crewe West | 82.8% | 4.6% | 0.5% |
| Crewe East | 84.3% | 3.5% | 0.7% |
| Crewe North | 84.1% | 4.6% | 0.6% |
| Cheshire East | 76.9% | 5.6% | 4.3% |
Oil heating hardly arises in town: 4.3% across the borough, under 1% in every Crewe ward. Electric heating is the Crewe question. 16.6% of Crewe Central households and 9.8% of Crewe South households heat with electricity alone. In many such homes that means storage heaters that charge overnight. Electric heating and solar explains why that changes what panels are for.
Using these figures
A ward figure tells you what is common around you, not what your home is. The route planner on the home page takes your own answers. For the method and the Census tables used, see data and sources and the Census 2021 releases on Nomis.