In brief
An unshaded south roof at 35° in Crewe makes about 951 kWh a year for each kWp of panels; the best case in our runs, south at 40°, makes 953. East and west faces each make about 80% of that. North faces make about 54%. Shade from chimneys and neighbours comes off every figure.
953 kWh per kWp a year on the best Crewe roof in our runs.
The full table
Each figure is the yearly output of 1 kWp of panels at that direction and pitch, at 53.099° N, 2.44° W, from PVGIS 5.3. Multiply by the size on a quote: a 3 kWp array on a south roof at 35° comes to about 2,853 kWh.
| Roof faces | 10° | 20° | 30° | 35° | 40° | 45° | 50° |
|---|---|---|---|---|---|---|---|
| South | 862 | 912 | 943 | 951 | 953 | 951 | 943 |
| South-east | 842 | 877 | 896 | 900 | 899 | 893 | 883 |
| South-west | 840 | 872 | 889 | 892 | 889 | 883 | 872 |
| East | 791 | 784 | 771 | 761 | 750 | 735 | 718 |
| West | 787 | 776 | 761 | 751 | 738 | 723 | 706 |
| North-east | 737 | 679 | 623 | 597 | 571 | 545 | 519 |
| North-west | 734 | 674 | 618 | 591 | 566 | 540 | 514 |
| North | 712 | 634 | 557 | 519 | 481 | 444 | 408 |
Two patterns stand out. South-facing roofs barely change between 30° and 45°, so the pitch of an ordinary Crewe roof is rarely the problem. North-facing roofs fall away quickly as they steepen, which is why an array is rarely put on a north slope.
Front and back: two faces of one roof
Most terraces and semis in Crewe have a pitched roof with two faces pointing in opposite directions. Which pair you have decides whether one face does the work or both share it.
| If one face points… | That face | The other points… | That face |
|---|---|---|---|
| south | 951 | north | 519 |
| south-east | 900 | north-west | 591 |
| south-west | 892 | north-east | 597 |
| east | 761 | west | 751 |
A roof running north to south gives one strong face and one weak one. A roof running east to west gives two middling faces, and splitting panels across both is common: each face makes less, but output is spread from early morning to evening, which suits a household out at work or one heating water with the surplus. Small outrigger roofs over back kitchens often face east or west too; on a terrace they may be the only roof in reach of the scaffold. Terraced houses and semi-detached roofs go into the practical side.
Month by month
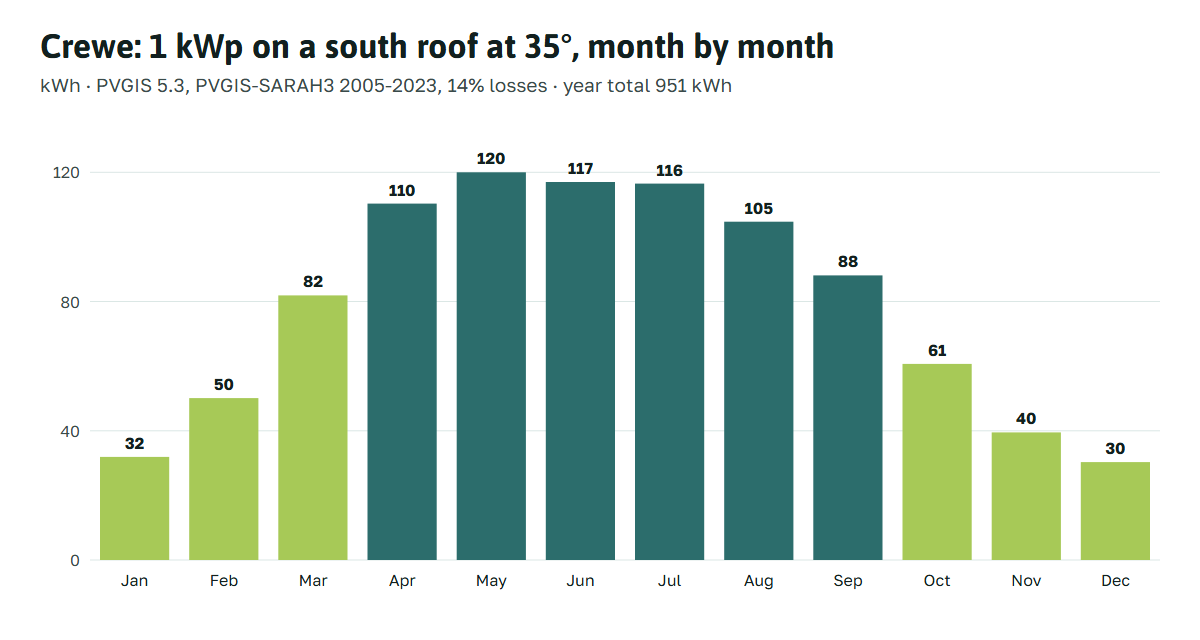
| Jan | Feb | Mar | Apr | May | Jun | Jul | Aug | Sep | Oct | Nov | Dec |
|---|---|---|---|---|---|---|---|---|---|---|---|
| 32 | 50 | 82 | 110 | 120 | 117 | 117 | 105 | 88 | 61 | 40 | 30 |
November, December and January together make 102 kWh per kWp; May, June and July make 354. That gap is the reason storage and hot-water diverters come up so often, and the reason panels do little for winter heating. For homes heated by electricity alone, electric heating and solar works through what the winter figures mean.
From sunlight to 951 kWh
Behind each number in the table is a short chain of estimates. For a south roof at 35° in Crewe, PVGIS finds about 1,173 kWh of sunlight reaching each square metre in an average year of 2005-2023 (PVGIS 5.3). One kWp of panels is defined by its output in sunshine of a kilowatt per square metre, so an ideal array would match that figure exactly. The model then subtracts what a real one loses: 3.2% where low sun skims off the glass, 4.2% to heat and dull light, and our 14% for wiring, the inverter and grime, while adding 1.7% for a spectrum that suits silicon. The result is 18.9% below the ideal, which is the 951 kWh in the table.
How much one year differs from the next
Crewe’s figure is an average, and PVGIS puts the typical swing around it at 30 kWh per kWp a year, among the larger swings of the six towns we ran. On a 4 kWp terrace roof that is about 120 kWh either way. The bright months do most of the moving: July varies by about 15 kWh per kWp from year to year, December by under 6. When comparing a new system with the table, use at least a full year of readings.
Terraces, cottages and pitch
Terraced houses make up about three in eight homes in Crewe Central and Crewe South (Census 2021), most with one slope to the street and one to the yard. Which slope faces the sun is set by the direction of the street, which is why the pairs above matter more here than the best-case figure. Pitch matters less: PVGIS’s own optimum for a south slope in Crewe is 40°, worth 2 kWh per kWp more than 35°, and the surrounding land makes no measurable difference. For an ordinary terrace, terraced houses covers fitting panels to a narrow slope. For the listed railway cottages the planning route, not the output, decides what is possible, as railway cottages explains. Either way, set the kWh you expect against the price per kW on the cost page.
Crewe against nearby towns
We ran the same model, with the same settings, for other towns in this part of Cheshire. The spread is small.
| Town | kWh per kWp |
|---|---|
| Nantwich | 959 |
| Winsford | 954 |
| Crewe | 951 |
| Frodsham | 941 |
| Northwich | 939 |
| Congleton | 909 |
Checking a quote against these figures
An MCS-certified firm has to give you a performance estimate for your roof (MCS). Find your direction and pitch above, multiply by the system size and compare. An estimate well above the table needs explaining; one a little below, with shading noted, is often the honest answer. What the units are worth depends on your tariffs and on how many you use at home: export and self-use covers the SEG rules, and the route planner does the multiplication for you. For the paperwork that comes with a quote, see choosing an installer.